
1. Unlisted Ellerston Asia Growth Fund and Listed EAI have virtually identical portfolios
Here are their portfolios from their 31 October 2018 monthly reports. They are over 95% consistent.


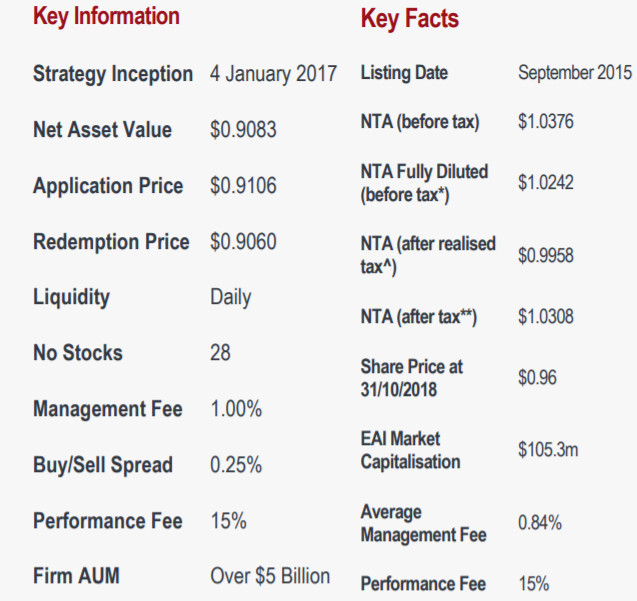
At 31 Oct 2018 the Key Facts about Ellerston Asia Growth Fund (EAGF) and EAI are below:
2. Comparing Unlisted (EAGF) and Listed LIC (EAI) Returns
EAGF's web page provides a unit price history which can be downloaded to Excel. Alongside I've added EAI's NTA figures from its monthly reports:

With a baseline of 30 June 2018 (after EAGF distribution) you can see columns 3 and 7 track the performance of both EAGF and EAI to 29 Mar 2019.
- At 31 Oct 2018 EAGF dropped 10.07% to .8993 while EAI dropped 11.54%
- At 29 Mar 2019 EAGF was up 3.13% while EAI was still down 0.26% - a total difference in outcome of 3.39%. This includes the EAI dividend and franking credit of 1.43 cents.
EAGF investors still have to pay tax on their annual distributions (unless retired and holding them in superannuation) but there is still a clear tax benefit obvious in this example to not having tax paid by a LIC and just having the full return passed through which is what unlisted funds and LITs do.
EAI's undistributed franking credit balance was reported on 11 March 2019 to be around 2.9 cents / share after the March dividend. This undistributed franking may never be fully returned as it requires the payment of very high dividend levels which most actively-trading managers are loathe to do as it reduces their fee base. The smaller the fund, the harder it is for it to raise capital, and the more volatile its returns, the less likely it is to pay high enough dividends to return all franking credits (e.g. see PAF's high and growing franking balance.)
The other key factor in EAI's lower returns is due to the dilution of option exercise which was mostly due to the underwriting Ellerston arranged. This dilution is noted in its 11 Mar 2019 announcement.
Finally, it's possible that after the option exercise of $35 million including underwriting there was a much migher cash level than usual for EAI during a period of high market returns.
EAI acknowledges the negative effect on NTA of tax and option dilution in its Feb 2019 report:
<<
There are a number of factors, other than performance, that influenced the fully diluted before tax NTA during the month. First, the company paid tax of approximately $4.6 million, which reduced the fully diluted before tax NTA by approximately $0.04. Secondly, approximately 20.4 million options were exercised in total and 14.2 million during February. Finally, approximately 21.7 million EAI options were underwritten as per the March 1 notification to the ASX. The fully diluted before tax NTA, including the partial underwriting, was $1.0863 as of the end of February versus $1.0645 at the end of January.
>>
Note: One other factor that explains variance in returns between LICs (or LITs) and unlisted funds is buybacks. LICs can undertake these at substantial discounts to NTA which with enough volume can make an appreciable positive difference to NTA. In this period, this wasn't relevant for EAI.
3. Don't trust most fund manager's NTA figures until you've properly checked them
This case provides yet another example of why you can't just trust a fund managers headline NTA figure. EAI only quotes the most flattering figure (NTA before any tax including realised) in its Weekly NTA reports - which is extremely misleading.
And even in its Monthly reports up to the options expiry it provided four NTA figures but not the true NTA after realised tax and fully diluted.
As of 31 Jan 2018 it was claiming headline NTA of around $1.10 when the true figure was closer to $1.02:


